Gold Rush?
Wednesday, June 30th, 2021
It has been said that ‘‘all that glitters is not gold.’’ While I would like to credit country western music singer, Dan Seals, with the line it is actually attributed to none other than William Shakespeare. Its meaning is that not all that looks precious or true, turns out to be so. A fitting statement in the age of crypto currency as we have seen wild fluctuations in Bitcoin and the like, and which some have compared to the heavy yellow metal (gold) due to the finite number of coins that can be ‘‘mined.’’ While fears of inflation initially stoked both ‘‘metals’’ higher, it seems that Bitcoin is subject to Elon Musk’s Twitter rants and Chinese authorities, raising the question whether it can be called a true store of value. Time will tell, but it is clear that the technology behind cryptocurrencies is here to stay as block chain, smart contracts, and decentralized finance continue to grow in use and popularity. While these intangible coins may not be worth their weight in gold, they certainly hold significant power.
Meanwhile as the world re-opens, another well-known commodity known as black gold has continued to steadily march higher, spurred by thirsty travelers ready to resume their lives and vacations. As the level of fully vaccinated people grows, OPEC is trying to agree upon how to gradually return the millions of barrels a day that were taken off the market during the pandemic. Restoring the balance of supply and demand is more difficult when it is a moving target. Higher oil prices have helped beleaguered energy stocks that have been on a downward spiral over the last five years, allowing them to drastically outperform the technology and large cap growth stocks that lead the 2020 recovery. ‘‘Stay at home’’ has been replaced with ‘‘put the pedal to the metal’’ and ‘‘wheels up’’!
Whether metals, oil, or shiny beef cattle, commodities as a whole have been on a bull run. The massive demand for lumber has finally hit a tipping point as builders put the brakes on construction. Between supply constraints and shipping backlogs, most everything is in short supply. This includes vehicles that depend on new glossy microchips, which have pushed the used-car market into overdrive. While June inflation estimates have fallen to 4.1% vs. May’s CPI reading of 5.0%, the question still lies: Is this inflation transitory or something that might linger?
Inflation is also affecting wages, especially at the lower end where many jobs were lost in food service and hospitality. Several major companies have announced boosts in their minimum wage to $15/hour and are even offering signing bonuses to attract laborers back to work. And while there are 8 million people still unemployed, there are 9 million job postings, giving workers more leverage in negotiations. So will these higher wages result in higher prices and/or lower margins? One factor that may help is technology. COVID caused us to embrace technology and to boost productivity, replacing many manual tasks with computers and machines. There is no putting the genie back in the bottle.
In addition, technology affords consumers greater price discovery and the ability to substitute one good for another…perhaps even substituting the purchase of a new car with telecommuting. Therefore, while McDonald’s may offer a higher wage, they will probably require fewer workers, utilizing technology to combat inflation and ensuring your Big Mac prices will not be Supersized.
Whether transitory or not, the markets were seemingly undisturbed by the debate, delivering positive results across asset classes, and even the bond market performed, with the 10-year yield continuing to retreat, resulting in positive returns. Real GDP growth for Q1 came in at 6.4% and is expected to exceed 9% in Q2. Much of this growth has been driven by the pent-up consumer, but more importantly, by business investment and capital expenditures which grew by 11.7% for the quarter. Manufacturing and services remained strong despite continued supply chain issues and labor shortages, with the July ISM Index posting a whopping 60.6 (above 50 signals expansion).
Closing Thoughts
Since the beginning of time man has chased shiny objects, whether seeking fame or fortune. Yes, ‘‘there’s gold in them there hills!’’ It seems fitting that the opening ceremonies of the long anticipated, pandemic-delayed Olympic games is upon us. Over sixteen days of glory, athletes from around the world will compete for the honor to adorn themselves with bronze, silver, or gold, and make their countries proud. Many of these competitors have been working their whole lives for this moment and their bodies are primed for peak performance. Every athlete has a routine to not only prepare for the physical exertion they must expend, but also for the mental game each one carries in their proverbial helmet. Whether listening to their headphones or following a specific dressing ritual; each has their own idiosyncrasies, superstitions, and step-by-step practices to prepare for battle.
At Ulrich, we see ourselves as your financial athlete where we stand ready to help navigate the complex field of challenges and keep your eye on the goal. Our focus on a consistent process and long-term financial fitness helps provide a method to the madness of global markets and eases the mental pressure of protecting your life’s work. That’s our Aim, that’s our Target!
John P. Ulrich, CFP®
President
Whitney E. Solcher, CFA®
Chief Investment Officer
Equity Markets
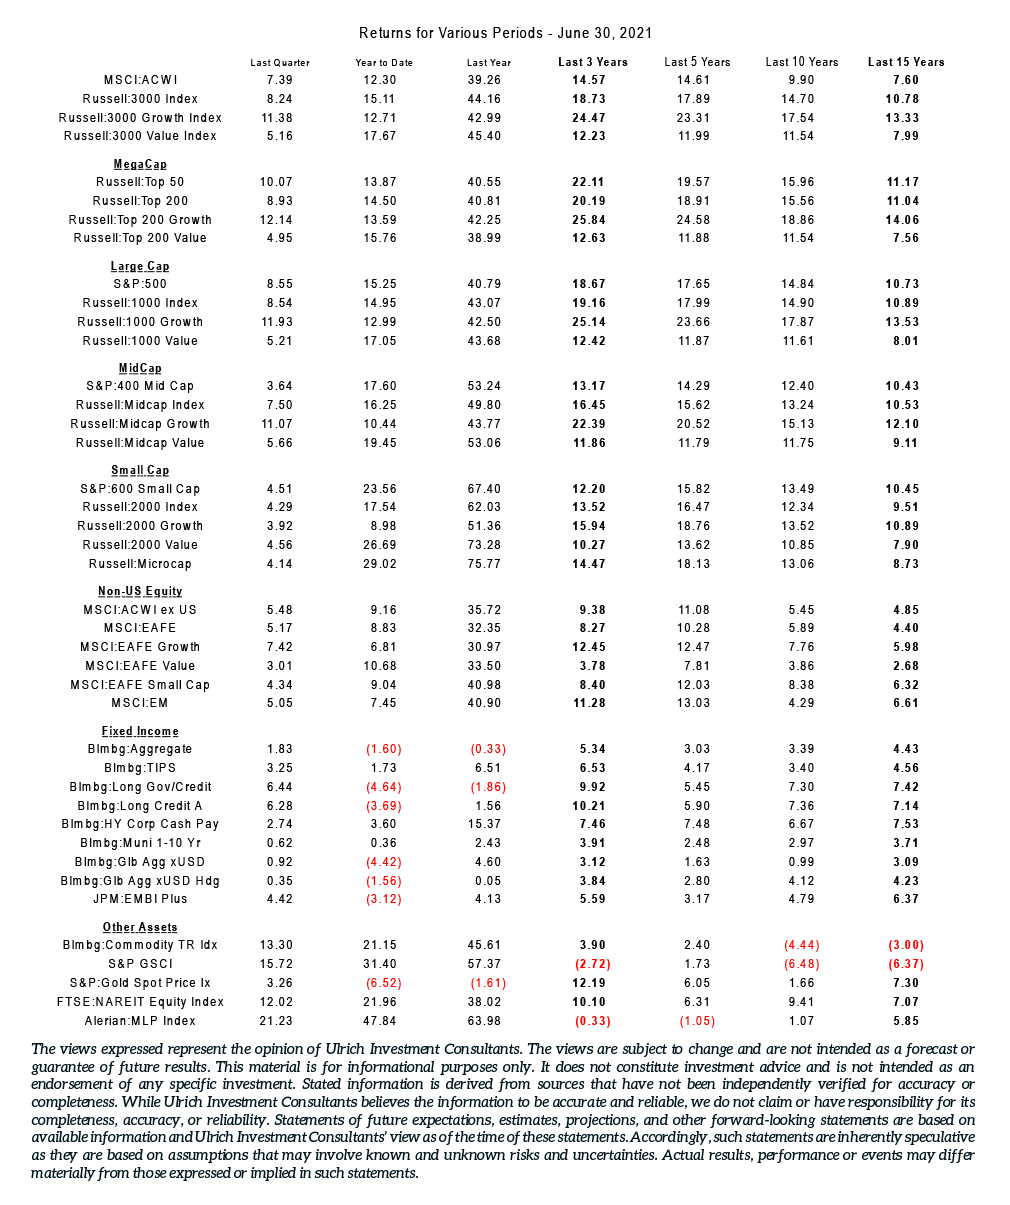
The S&P 500 Index closed the quarter at a record high and registered an 8.5% gain in 2Q, bringing its YTD return to 15.3%. The Index is up 40.8% over the past year and the annualized return over the past 10 years is a healthy 14.8%. The S&P 500 Index hit 34 record highs in the first half of the year. First quarter earnings were up over 50%, according to FactSet, and second quarter earnings are projected to grow more than 60% (YOY). Real Estate was the strongest-performing sector in the S&P 500 for the quarter (+13.1%) with Technology close behind (+11.6%). Utilities was the only sector to post a negative result (-0.4%). Growth stocks outperformed value (R1000 Growth: + 11.9%; R1000 Value: + 5.2%) but lagged for the YTD period (+13.0% vs. +17.0%). Small cap lagged large (R2000: +4.3% vs. R1000: +8.5%) and also trails by a modest margin YTD (15.0% vs 17.5%).
Developed ex-U.S. stocks also had a strong quarter with virtually all developed market countries posting positive returns. The MSCI ACWI ex-USA Index rose 5.5% for the quarter and is up 9.2% YTD. As in the U.S., Utilities (-0.4%) was the lone sector to produce a negative return. Health Care (+9.9%) and Energy (+8.2%) were the top-performing sectors. Canada (+10.0%) was a strong performer and Japan (-0.3%) was notable as the lone country to deliver a negative return. The U.S. dollar was mixed against developed market currencies and thus shifts were not a major contributor to relative results. The MSCI EM Index performed in line with developed markets (MSCI EM USD: +5.0% and +7.4% YTD), but country returns were mixed. Brazil (+23%) and Russia (+14%) were top performers while Chile (-14%) was at the bottom of the pack. China was up 2% and China A-shares (+9.2%) did especially well as softer economic data in May appeared to ease investors’ concerns over potential policy tightening.
Fixed Income Markets
The 10-year U.S. Treasury yield declined steadily throughout the quarter, from 1.74% as of 3/31 to 1.45%. TIPS outperformed nominal Treasuries for the quarter given strong relative performance in April and May. The Bloomberg Barclays US Aggregate Bond Index rose 1.8% but remains down 1.6% YTD. Strong equity performance and robust economic data fueled risk appetites, and lower-quality securities were the best performers again this quarter. Corporates outperformed Treasuries as investors continued to reach for yield in spite of the paltry yield advantage (the average option-adjusted spread on the Corporate Index was 80 bps as of quarter-end, the lowest since 1998). The Bloomberg Barclays High Yield Index was up 2.7%. The absolute yield-to-worst for the Index reached an all-time low of 3.75% and its option-adjusted spread hit 268 bps, the lowest since 2007. Municipals (Bloomberg Barclays Municipal Bond Index: +1.4%) performed in line with Treasuries for the quarter. The U.S. dollar was mixed versus developed market currencies but shifts were fairly modest. Thus, currency was not a major contributor to relative results for global ex-U.S. indices. The Bloomberg Barclays Global Aggregate ex-US Bond Index rose 0.9% (+0.4% hedged). Emerging market debt performed well; the JPM EMBI Global Diversified Index gained 4.1% and the local currency JPM GBI-EM Global Diversified Index was up 3.5%. Both remain down YTD, however; -0.7% and -3.4%, respectively.
Real Assets
Real assets did very well as the economy continued to gain traction. The Bloomberg Commodities TR Index rose 13.3%. Oil prices continued to climb, closing at more than $73 per barrel, the highest in almost three years. The Alerian MLP Index was up 21.2% for the quarter and 47.8% YTD. The S&P GSCI Index climbed 15.7% and is up 31.4% YTD. REITs, as measured by the MSCI U.S. REIT Index, rose 12.0%. The Bloomberg Barclays US TIPS Index gained 3.2% and the Dow Jones Global Infrastructure Index climbed 6.9%. Gold (S&P Gold Spot Price: +3.3%) was an underperformer for the quarter.