Two Weeks
Wednesday, March 31st, 2021
Just like the 1986 Tom Hanks movie classic ‘‘The Money Pitt,’’ the global pandemic timeline has continued to disappoint. In this film, the general contractor continues to estimate the massive home renovation project at ‘‘two weeks’’ and two weeks later the timetable is still projected at another ‘‘two weeks,’’ and so on, and so forth. It’s hard to believe that it was just over a year ago, when we were told ‘‘two weeks’’ — Just quarantine for two weeks, and all will be well and good in the world. That two-week initial lockdown turned into two months, then two quarters, and now we enter year two of this never-ending drama called Corona. Many folks have been missing their two-week paycheck, hopefully supplemented by round two of the Paycheck Protection Program. As I await shot two of the vaccine, I do remain hopeful that the end is near and that we can finally send this delinquent general contractor (aka ‘‘the virus’’) packing.
One thing that has been delivered ahead of schedule is the vaccine. Despite a slow start, shots in arms are arriving and even the sheer news has fueled optimism of an opening economy and has continued to drive equity prices higher. The winners of late, however, are not the large tech stocks that drove 2020 returns, but instead the stalwarts (cyclicals) of a bustling economy. Energy has made a 180-degree reversal based on expectations of increasing demand and optimism for future travel plans, alongside gains in industrials, materials, and financials. Likewise, small caps have flourished as factories reopen and retail has regained a pulse. Meanwhile, growth stocks have pumped the breaks, given a rise in the 10-year Treasury yield (closing the quarter at 1.74%), due to concerns of increasing inflation, which adversely affects their valuations. Our views are, while pent-up demand will likely have a short-term effect on price gains, it is primarily due to supply chain issues and should not have a protracted impact. Long-term, secular changes including technology innovation and shifting demographics continue to temper inflationary pressures. As the Fed has repeatedly made clear, it is willing to accept inflation that runs above 2% in order to reach a longer-term average of its 2% target. As of February, the year-over-year CPI reading was 1.7%. We’re hardly Venezuela! All in all, the sector rotation we have seen this quarter has been quite calm and orderly, almost eerily so…perhaps everyone is feeling a little better!
Like many Americans, I too have been doing some home renovation, which seems to be a popular hobby during the lock-down and one of the bright spots in the economy. Despite the recent increase in rates, housing as a whole has flourished during the pandemic, spurred by low mortgage rates and low inventory as people flee the cities for the suburbs (there are now more realtors than houses for sale in the U.S.!). This has resulted in a year-over-year price increase of 11% across major cities, the highest annual rate since 2006.
Along with housing construction, I think most everyone can agree that our nation’s infrastructure is in desperate need of a facelift. Not only roads and bridges, but the pandemic made it extremely clear that our nation has failed poor and rural areas when it comes to broadband access. In addition to the $1.9 trillion stimulus package that was signed into law, a $2.3 plus trillion infrastructure proposal lies in the wings. The recently passed stimulus package represents roughly 10% of U.S. GDP and with last year’s stimulus, the total is about $5 trillion, or 25% of U.S. GDP. The recent package included $1,400 checks to qualified individuals, an extension of unemployment insurance and aid to state and local governments. The Congressional Budget Office projects that the federal budget deficit will reach $2.3 trillion in 2021, just over 10% of GDP and the second highest level since 1945, exceeded only by last year’s figure. In the 2020 fiscal year, which ended Sept. 30, the deficit hit a record $3 trillion. Note also that the CBO’s 2021 projection does not include the recent $2 trillion stimulus package.
Employment gains, consumer spending and confidence posted the largest one-year gain in 18 years, reflecting continued growth and optimism despite the fact that labor participation is still quite low. In other good news, manufacturing continued its recovery with the ISM posting a reading of 64.7 (anything greater than 50 signals expansion), the highest since 1983. Fourth quarter real GDP was revised up to 4.3%, bringing the 2020 figure to -3.5%. A survey of economists by The Wall Street Journal revealed that the average 2021 forecast was boosted to 6%, which would be the fastest pace since 1983.
Closing Thoughts
Yes, the year of the Ox seems to be doing exactly what Oxen are supposed to do — move slowly and steadily with strength and reliability. The Ox is a worker and we have plenty of nails that need hammering and potholes to be filled. The Fed has set the course with its unwavering commitment to remain accommodative until it meets its full employment and inflation objectives, providing clarity to what we hope to be a smooth recovery in 2021. However, even oxen can sometimes stumble in the field and we are sure to see our share of fits and starts (and ‘‘change orders’’); however, if we can simply keep on track and adhere to a disciplined investment process that includes a well-defined long-term asset allocation, which is the basic foundation and architecture of a good financial plan, we shall persevere. It’s time to give Corona it’s two-weeks notice!
Regards,
John P. Ulrich, CFP®
President
Whitney E. Solcher, CFA®
Chief Investment Officer
Equity Markets
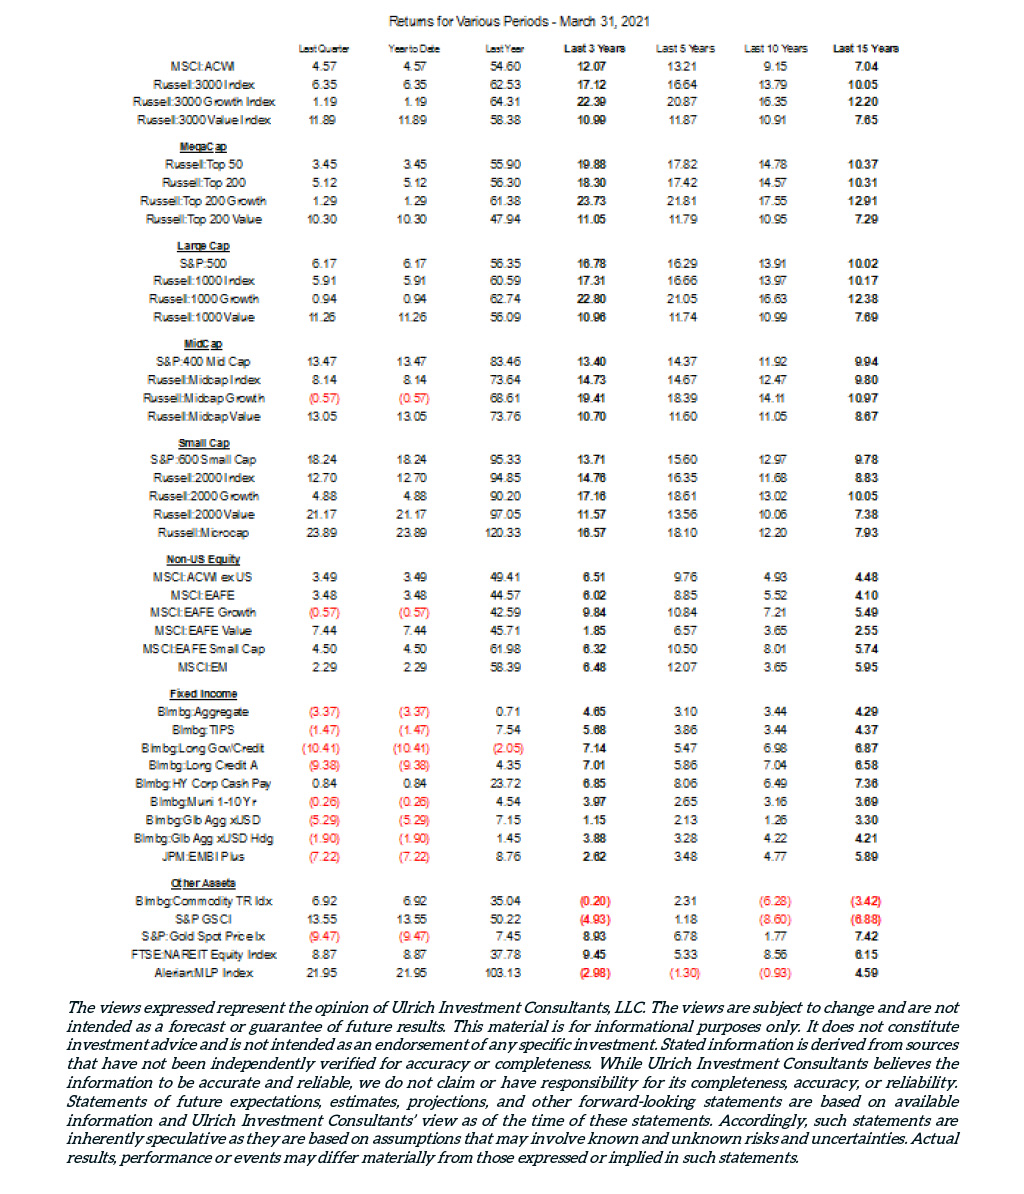
U.S. equity indices delivered mostly positive results (Russell MidCap Growth was the lone exception with a 0.6% loss). The S&P 500 Index (+6.2%) was led by Energy (+30.9%) and Financials (+16.0%), while Information Technology (+2.0%) and Consumer Staples (+1.1%) lagged. Value sharply outperformed growth; R1000V: +11.3%; R1000G: +0.9%. Value stocks have underperformed growth since the market peak in February 2020, but the gap has narrowed significantly over the last two quarters. Small cap stocks sharply outperformed large cap during the quarter (R2000: +12.7%; R1000: +5.9%), benefiting from less exposure to the Technology sector as well as strong performance from Retail. Certain sectors have experienced sharp double-digit increases in recent months as vaccine-induced optimism has fueled a rebound. Data from JP Morgan shows that from Nov. 6, 2020 (reflecting the last business day before it was announced that a vaccine candidate had better than 90% efficacy against COVID-19), airlines, energy, retail REITs, and cruise lines/hotels/resorts have soared more than 50%.
Global ex-U.S. indices posted positive results but generally lagged the U.S., due largely to U.S. dollar strength. The MSCI ACWI ex-USA Index gained 3.5% but was up 6.5% in local currency terms. The greenback gained 6.6% vs. the yen and nearly 4% vs. the euro over the quarter on bright prospects for economic growth in the U.S. and rising interest rates. The U.K. (+6.2%) delivered relatively strong results while Europe (+3.5%) and Japan (+1.6%) lagged. As in the U.S., small cap stocks outperformed large; value outperformed growth; and Financials did especially well. Emerging markets lagged developed markets; the MSCI Emerging Markets Index gained 2.3% and 4.0% in local terms. China (-0.4%) and Brazil (-10.0%) were laggards as President Xi intensified regulation of China’s tech sector, pressuring share prices, and Brazil struggled to contain COVID-19. Taiwan (+10.9%) was a top performer, and the country is up more than 90% over the last 12 months, boosted by its heavy weighting in and strong performance from Technology stocks. In contrast, South Korea posted a muted 1.6% gain.
Fixed Income Markets
Concerns over future inflation drove the 10-year U.S. Treasury yield to an intraday high of 1.77% in March, a 15-month high, before closing the quarter at 1.74%, up from 0.93% at yearend. The Bloomberg Barclays US Treasury Index fell 4.3%, and the long-term US Treasury Index (-13.5%) suffered its harshest decline since 1980. TIPS (-1.5%), outperformed nominal Treasuries as 10-year breakeven spreads widened from 1.99% at year-end to 2.37% as of March 31. The Bloomberg Barclays US Aggregate Bond Index fell 3.4%, with spread sectors outperforming Treasuries and lower quality faring the best. High yield corporates posted a 0.8% gain, as measured by Bloomberg Barclays, amid a record-making spate of issuance. The CCC-rated sector gained 3.6%, benefiting from risk-on sentiment, rising stock markets, and the recovery of some COVID-19 victims (airlines, retail, energy). Bank loans, which have floating rate coupons and a relatively short duration, gained 1.8% (S&P LSTA). Municipals outperformed U.S. Treasuries against a favorable supply/demand backdrop (Bloomberg Barclays Municipal Bond: -0.4%). In addition, the market was supported by the $350 billion allocated to support state and local governments in the recent stimulus package.
Rates also rose overseas and a strengthening U.S. dollar further eroded foreign bond returns for U.S. investors. The Bloomberg Barclays Global Aggregate ex-US Bond Index fell 5.3% (-1.9% hedged). The dollar gained nearly 4% versus a basket of currencies. Emerging market debt returns were also negative. The JP Morgan EMBI Global Diversified fell 4.5% and the local currency JP Morgan GBI-EM Global Diversified sank 6.7%.
Real Assets
Real assets posted strong returns in 1Q on prospects for a robust recovery as well as a potential hedge against coming inflation. Oil prices continue to climb with Brent Crude oil closing at over $60/barrel. The Alerian MLP Index was up 22% for the quarter. The S&P GSCI Index soared 13.5% although gold (spot price: -9.5%) declined. REITs, as measured by the MSCI U.S. REIT Index, rose 8.8%. The Bloomberg Barclays 1-10 Yr. US TIPS Index posted a muted 0.6% result, but outperformed nominal U.S. Treasuries as inflation expectations rose.